
Chart
Bar, line, pie, doughnut, radar or polar area chart, in the theme's colors
The examples are only part of the story. Every tile also has the advanced options: animations, mouse effects, visibility by device or by date, positioning and more.
01
Just added
This is how it looks as soon as you add it to the page, before any changes.
02
Nights booked at a B&B, month by month
Rounded bars, the summer months in solid red and the others in a tint, a barely visible horizontal grid, title and values with the suffix “nights” in the tooltip; inside a light card.
03
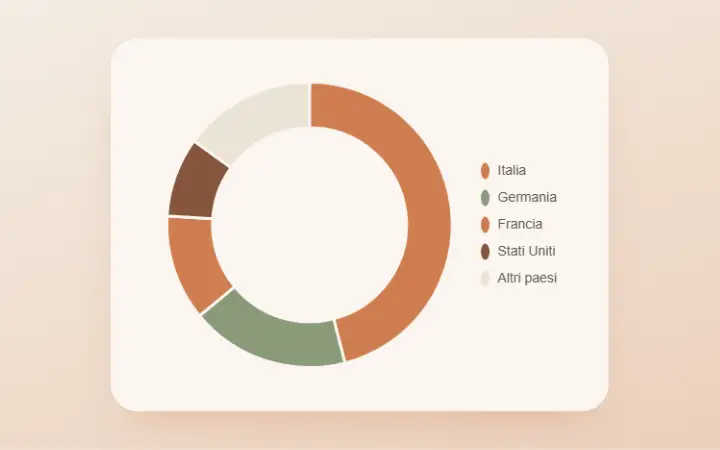
Where the guests come from
A thin doughnut with a big hole, legend on the right with circular indicators and five theme colors; the value in the tooltip has the % symbol.
04
Soil moisture over fourteen days
A smooth line with a filled area, small points and light text on a blue background: there is a single line (global color), the fill is a transparent tint.
05
The season's goals, player by player
Horizontal pill-shaped bars on a night background: the top scorer in orange, the others in red, no vertical grid, light labels.
06
The profile of a red wine, as a radar chart
A six-axis radar with the area filled in transparent red, star-shaped points and a light grid: a wine shop's tasting sheet.
07
How a festival's budget is spent
A polar area on a light card: each wedge is as long as its expense, five theme colors with a white hairline, legend at the bottom and values in euros with the thousands separator.
08
Three indicators side by side, as doughnuts
A family of three doughnuts with the title above: each has two data points, the full value and the rest in a soft tint; no legend, wide hole.
09
The ticket price, as steps, with the “Magazine Bold” style
The “Magazine Bold” style gives a black background and white text; on top, a line of red steps with no curves or fill: the price only changes at the start of the year.


